Email
Chat with tutors
logo

Ask Questions, Get Answers

X
 
Questions  >>  SAT  >>  Math  >>  Linear Equations
Answer
Comment
Share
Q)

The graph below represents the inequality<br> <br>

image

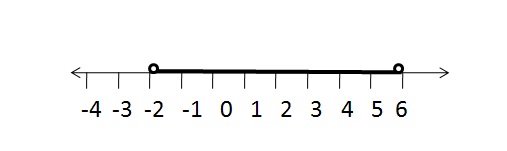
$(a) \;\{x:x \in R,-2 \leq x <6\} \\ (b) \;\{x:x \in R,-2 \leq x,x \leq 6\} \\ (c) \;\{x:x \in R,-2 < x <6\} \\ (d) \;\{x:x \in R,-2 < x \leq 6\}$</span>

1 Answer

Home Ask Tuition Questions
Your payment for is successful.
Continue
...