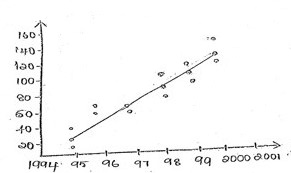
 Based on the line of best fit in the scatter above, which of the following is the closest to the average annual increase in coyotes in blue stone national Park between 1995 and 2000 ?
$\begin{array}{1 1} (a)\;22\\ (b)\; 24 \\ (c)\;26\\ (d)\;28\end{array}$


