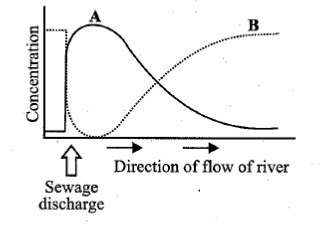
$\begin{array}{1 1} \text{a. Peak A- Sharp increase in BOD, disappearance of clean water organisms.} \\ \text{$\; \;$Peak B- Increase in dissolved oxygen , reappearance of water organisms.} \\ \text{b. Peak A- Increase in dissolved oxygen, reappearance of water organisms.}
\\ \text{$\; \; \;$Peak B- Sharp decline in dissolved oxygen, disappearance of clean water organisms.} \\ \text{c. Peak A-Sharp increase in BOD, appearance of clean water organisms.}
\\ \text{$\; \; \;$Peak B- Increase in dissolved oxygen, disappearance of clean water organisms.} \\ \text{d. Peak A-Increased number of anaerobic bacteria, disappearance of clean water organisms.}
\\ \text{$\; \; \;$Peak B- Sharp decline in dissolved oxygen, reappearance of water organisms.}\end{array}$


