Email
Chat with tutors
Login
Ask Questions, Get Answers
Menu
X
home
ask
tuition
questions
practice
papers
mobile
tutors
pricing
X
Questions
>>
SAT
>>
Math
>>
Linear Equations
Next similar question
Answer
Comment
Share
Q)
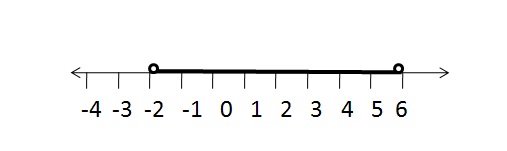
The graph below represents the inequality<br> <br>
(
a
)
{
x
:
x
∈
R
,
−
2
≤
x
<
6
}
(
b
)
{
x
:
x
∈
R
,
−
2
≤
x
,
x
≤
6
}
(
c
)
{
x
:
x
∈
R
,
−
2
<
x
<
6
}
(
d
)
{
x
:
x
∈
R
,
−
2
<
x
≤
6
}
</span>
Share
Please
log in
or
register
to add a comment.
Please
log in
or
register
to answer this question.
Found
1
answer. Click to login & view.
Next Similar Question >
Home
Ask
Tuition
Questions
Practice
Your payment for
is successful.
Continue
...
Please Wait